The standard way to compare what an AI model costs is to line up the price per million tokens and read off the cheapest. The number feels like a unit price, the way pence-per-litre lets you rank petrol stations. It isn’t. Price per token measures the rate of metering, not the size of the bill, and those two things come apart precisely where it matters most.
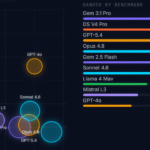
Disaggregate “price” into its two components — the rate per token and the number of tokens a task actually consumes — and the ranking moves. Output tokens cost four to eight times more than input tokens on every major provider, and a reasoning model can spend thousands of them thinking before it answers. The headline rate is real. What it masks is volume. A model that looks cheap per token can produce the more expensive answer, and the chart below is only the first half of that calculation.
The cheapest rate and the cheapest answer are different questions
It is tempting to read the bottom of this chart as the budget option. For a single short answer, that holds. For a reasoning task it can invert: a model priced low per token but inclined to emit long chains of intermediate tokens bills more than a pricier model that answers tersely. The rate is fixed; the volume is behavioural. Cost per task is the rate multiplied by how much the model decides to say, and only one of those two numbers appears on a price list.
Output pricing is doing most of the work
Most comparisons quote a single figure and move on. Toggle this chart from output to input and the bars compress sharply, because providers charge far more for tokens generated than for tokens read. That gap is the mechanism most per-token comparisons flatten. A workload that reads long documents and replies briefly lives on the cheap side of the meter; one that writes long answers from short prompts lives on the expensive side, and the same model can sit on either depending on the job.
“Per million tokens” hides the unit users actually feel
A million tokens is an abstraction; a single answer is what a user pays for. Reframing the rate around tokens-per-task rather than tokens-in-bulk is where the comparison becomes decision-useful. The published price correlates with cost, but it does not determine it. What determines it is the token budget of the work you actually run, which is why two teams using the “same” cheap model can end the month with very different invoices.
Methodology
Figures are published list prices per million tokens for the selected models, in US dollars, as of mid-2026, taken from each provider’s public pricing pages (OpenAI, Anthropic, xAI, Perplexity). Where a provider lists separate standard and cached input rates, the standard input rate is shown. The model selection is illustrative rather than exhaustive, spanning frontier and budget tiers across four providers. Pricing is the fastest-moving data on this site: rates change without notice and should be reverified against provider pages before being relied on. The chart shows rate only; it does not estimate tokens consumed per task, which varies by workload and, for reasoning models, by configuration.