
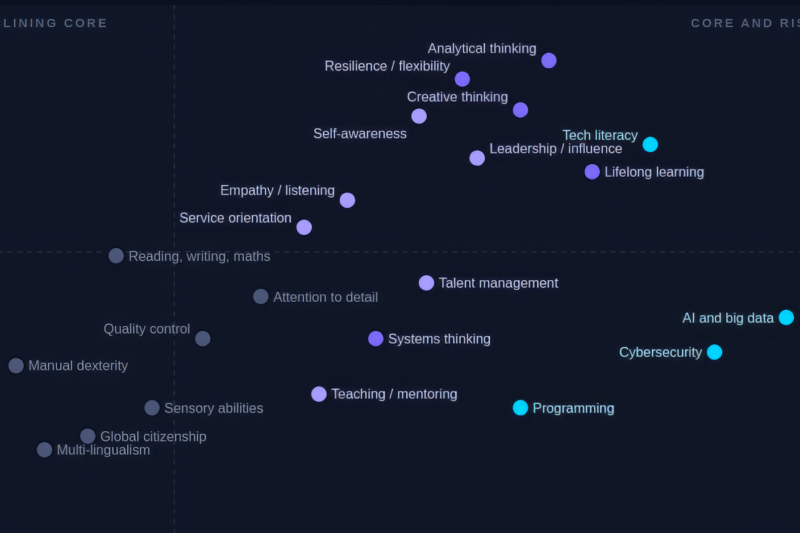
The “AI-proof skills” listicles say creativity and emotional intelligence. WEF’s employer survey says something else — and the lists don’t match.
“AI will replace the lowest-paid workers first” is the instinctive reading of most automation research. The task-level data complicates it considerably. Large language models are fundamentally text and reasoning tools, which means the jobs most exposed to this wave of AI are also, on average, the best-paid ones; lawyers, analysts, software engineers, financial professionals. That exposure doesn’t resolve uniformly into risk. Disaggregate it into augmentation and automation and a more precise picture appears: high earners’ exposure is predominantly a productivity multiplier; low earners’ exposure, where it exists, is more likely to mean displacement than enhancement. The seven charts in this cluster work through that distinction at every level of resolution; by salary band, by industry, by country, and by the jobs the transition is actively creating alongside those it disrupts.
The “AI-proof skills” listicles say creativity and emotional intelligence. WEF’s employer survey says something else — and the lists don’t match.
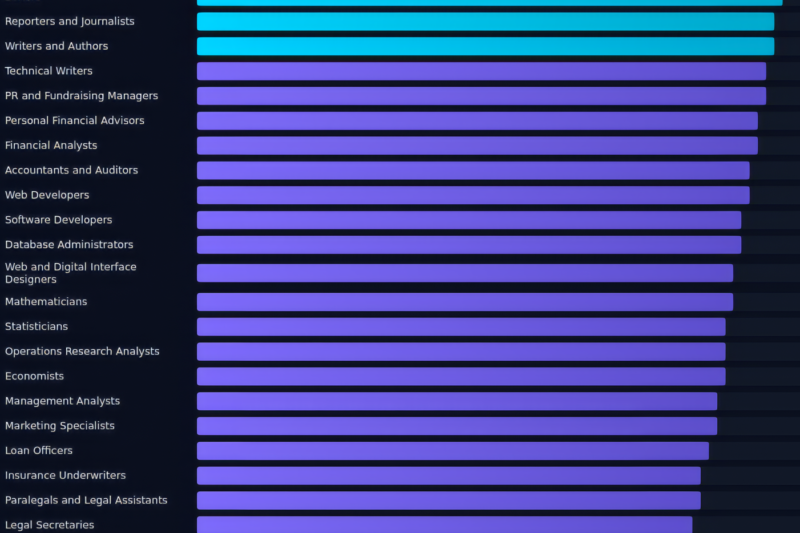
Headline rankings imply low-paid jobs go first. The Felten-Raj-Seamans index, toggled to wage, shows the top-exposed roles sit mostly above the US median.
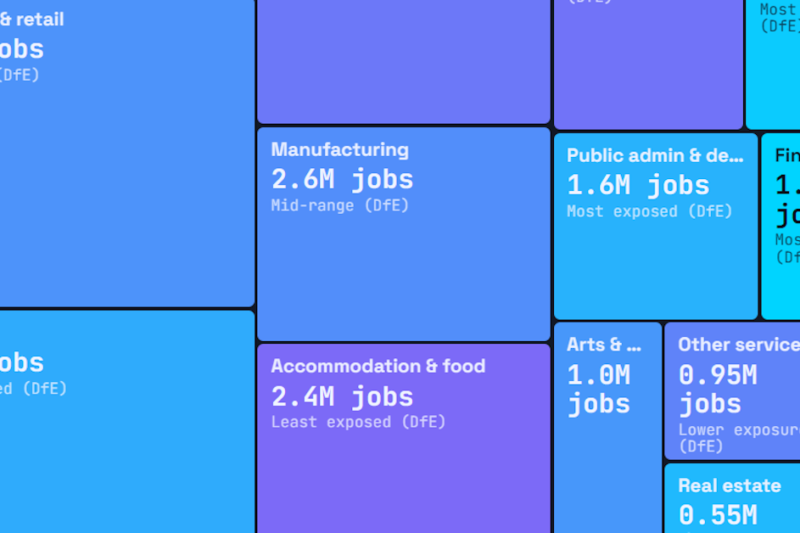
The DfE named finance Britain’s most AI-exposed sector. It’s also one of the smallest. A treemap of UK industries, sized by workforce and shaded by exposure — where the two pull apart.
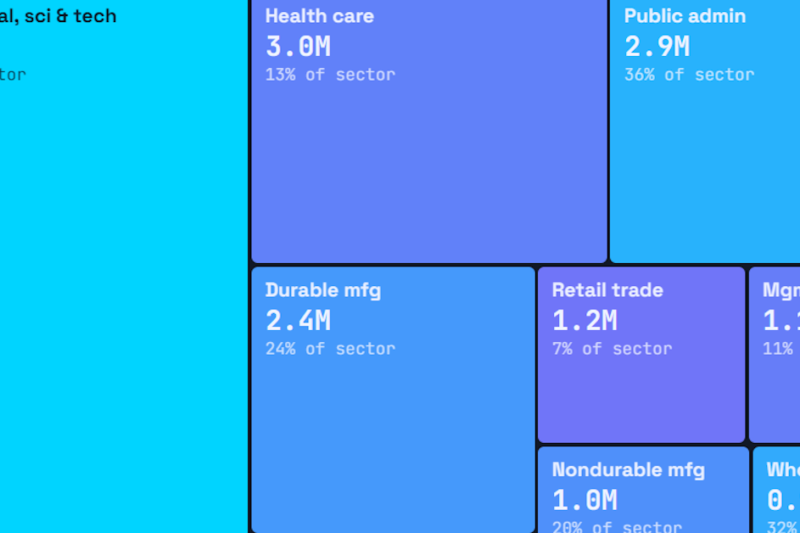
Most rankings sort industries by AI exposure rate. Size them by headcount instead and health care, retail and education dominate — a treemap of where AI exposure actually sits.
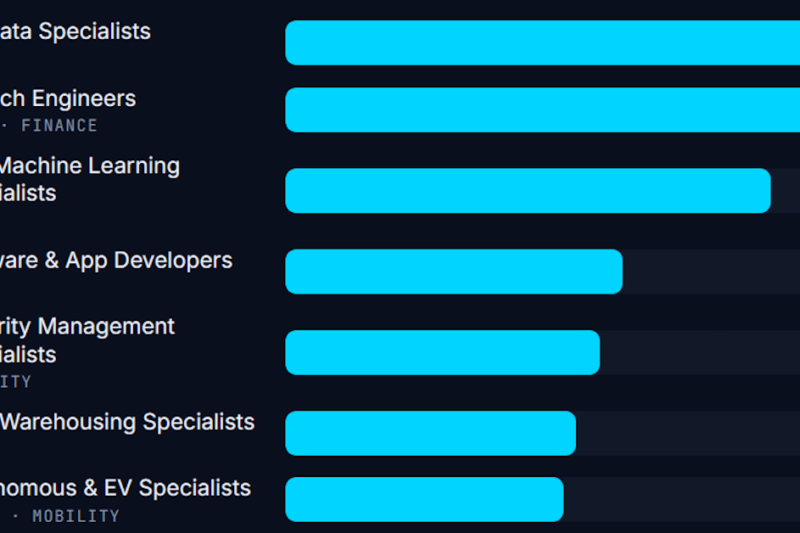
AI is creating jobs — but not the ones the headlines imply. We rank the 20 fastest-growing roles to 2030, then flip the metric to show where the jobs actually land
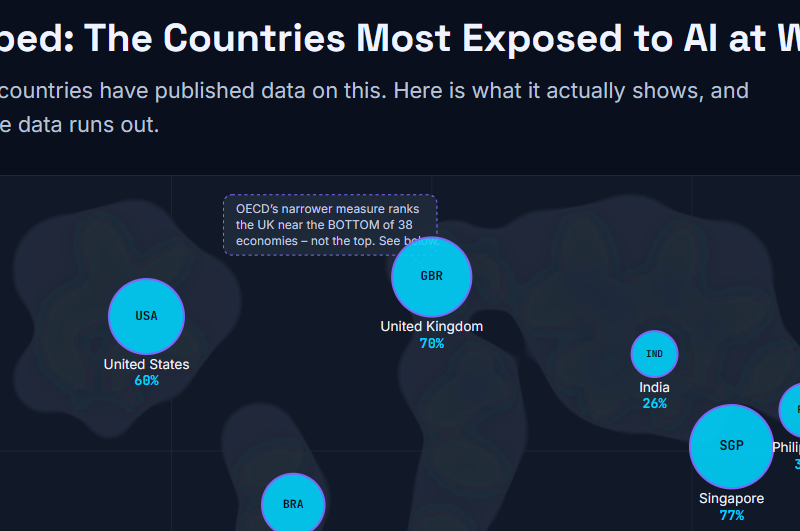
Most “AI exposure by country” maps imply data that doesn’t exist. Here’s what IMF and OECD research actually measures — country by country, with sources
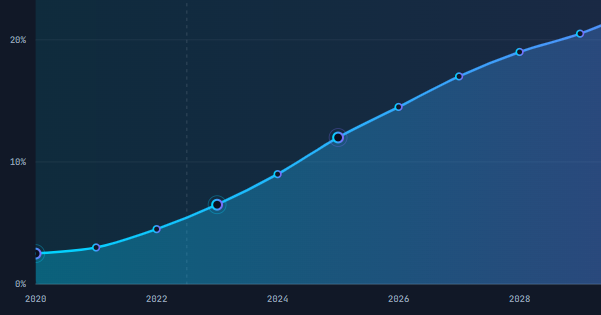
How fast is AI job displacement really accelerating? A visual timeline of automation risk from 2020 to 2035, mapped against PwC’s three waves of automation
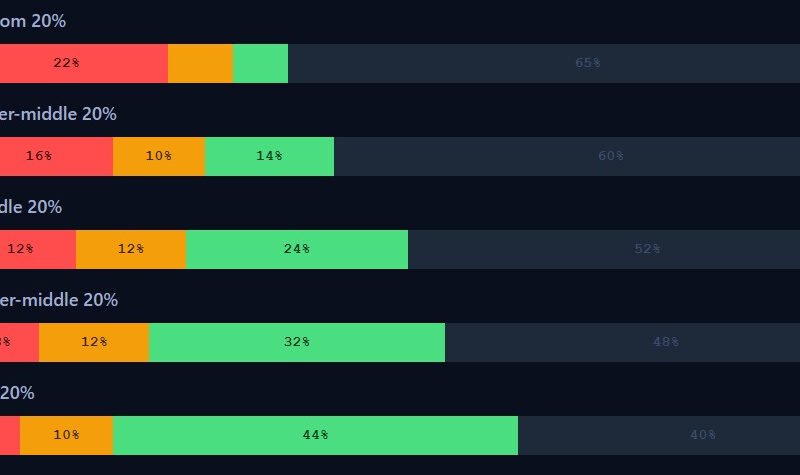
High earners face the most total AI exposure. Low earners face the most risk when exposed. How augmentation and automation diverge across five salary bands — and what it means for inequality, policy, and anyone planning a career.
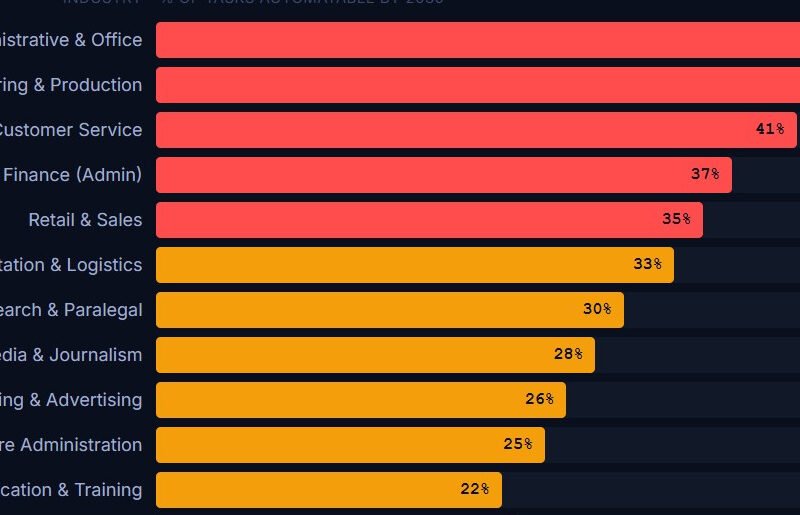
Administrative work leads the AI automation ranking — ahead of manufacturing. Fifteen industries ranked by share of tasks automatable by AI by 2030, with estimated global jobs displaced.