
“Most exposed to AI” almost always means a percentage; the share of a sector’s jobs that sit within AI’s reach. By that measure the ranking looks settled: professional and technical services lead, finance follows, and the caring and physical trades cluster near the bottom. The figure is real. It is also the wrong unit for the question most people think they are asking.
Resize the same sectors by the number of exposed workers and the order buckles. Health care carries one of the lowest exposure rates in the economy, around 13%, yet still holds roughly three million people in the most-exposed jobs – more than information, wholesale trade and utilities combined – because it employs over twenty million. Rate and headcount are different variables. The percentage measures how concentrated exposure is inside a sector; the count tells you where the exposed people actually are.
AIChartist.UK · Visualised
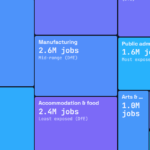
Which Industries Have the Most AI-Exposed Workers?
Sized by the number of U.S. workers in the most AI-exposed jobs, not the percentage at risk. Colour shows each sector’s exposure rate. The two rarely line up — toggle the sizing to see the gap open.
Professional services lead on both counts – which is what makes the percentage ranking feel trustworthy.
There is exactly one sector where rate and scale agree. Professional, scientific and technical services tops the exposure rate at 52% and tops the headcount at 6.2 million. That agreement is doing quiet work: because the most-cited ranking is correct at the very top, readers extend their trust to everything beneath it. The mechanism the percentage view obscures only appears once you leave first place.
Health care’s low exposure rate masks the second-largest pool of exposed workers.
Ranked by rate, health care sits in the bottom third at 13%. Ranked by people, it is the second-biggest tile on the board at three million. The disaggregation is simple arithmetic that the percentage suppresses: a small share of a very large workforce outweighs a large share of a small one. The variable that decides headcount is not the exposure rate at all; it is sector size, which the rate deliberately divides out.
Retail and education outrank the “high-risk” tech sectors on headcount.
Retail trade has nearly the lowest exposure rate in the economy at 7%, and still places 1.2 million workers in the most-exposed jobs; more than information (33%) at 0.92 million. Education, at 11%, lands 1.6 million, also ahead of information. The rate ranks the intensity of exposure within a sector; it cannot rank its mass. Treating a rate ranking as a map of where AI will land most people inverts the thing it actually measures.
A large tile is not a body count.
Pew’s measure is potential technical exposure. Work that AI could either perform or assist, not jobs lost. That distinction bites hardest in the biggest tiles. Exposure in professional services and finance correlates with analytical, higher-paid work, where it skews towards augmentation: the task gets easier, not eliminated. So the very sectors that dominate this treemap are disproportionately “assisted,” while the lower-rate physical and caring sectors are where exposure, when it comes, is more likely to mean substitution. Reading tile size as displacement reverses the gradient. The chart shows where AI reaches; it does not show who loses.
Methodology note
Each tile combines two figures. Exposure rates are from the Pew Research Center’s 2023 analysis “Which U.S. Workers Are More Exposed to AI on Their Jobs?”, which classifies the 873 occupations in the U.S. Department of Labor’s O*NET database (v27.3) by the relative importance of work activities with high AI exposure, then reports the share of each industry’s workforce in the most-exposed quartile. Employment is from the U.S. Bureau of Labor Statistics Current Population Survey, 2025 annual averages. The number of exposed workers shown for each sector is that sector’s employment multiplied by its high-exposure share.
Where the CPS reports combined industry groups, sub-sectors (educational vs health services; transportation vs utilities; arts/recreation vs accommodation/food; professional/technical vs administrative services) were apportioned using their relative shares in BLS establishment data. The total across all sectors is approximately 30 million workers, or about 18% of U.S. employment — consistent with Pew’s headline finding that 19% of workers are in the most-exposed jobs. “Exposure” denotes potential technical exposure, not predicted job loss, and figures cover the United States.

3 thoughts on “Which US Industries Have the Most AI-Exposed Workers?”