
When the Department for Education named finance and insurance Britain’s most AI-exposed sector, the line travelled as a warning about where the jobs will go. It measures something narrower. The ranking sorts industries by the average exposure of the work, not by how many people do it. And at the top of the ranking, those two things barely overlap.
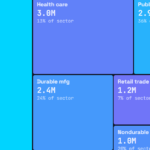
Finance and insurance employs about 1.2 million people, fewer than one in twenty-five UK workers. The country’s largest sector, human health and social work, employs roughly five million and sits in the bottom third of the same ranking. The exposure score correlates with how cognitive and clerical a sector’s tasks are; it says nothing about the sector’s size. Read as a map of affected workers, the ranking points away from where most Britons actually work.
AIChartist.UK · Visualised
Which UK Sectors Are Most Exposed to AI — and Where Are the Workers?
Every tile is a UK industry. Size = the number of jobs in it. Colour = the Department for Education’s AI-exposure ranking. Britain’s most-exposed sector employs barely a million people; its largest sits near the bottom of the ranking. Toggle the sizing to watch the two measures pull apart.
Britain’s most-exposed sector is one of its smallest.
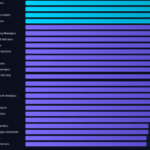
The DfE ranking puts finance and insurance first, information and communication second, and real estate fourth. Between them those three sectors employ around 3.4 million people. And real estate, at roughly half a million, is one of the smallest industries in the country. The ranking masks how thinly staffed the top of it is. An average exposure score is a per-worker measure of how AI-amenable the tasks are; it rises with the kind of work a sector does, not the amount, so a small sector of analysts and clerks can outrank an industry employing ten times as many people.
The UK’s largest employer sits near the bottom of the exposure ranking.
Human health and social work is the single biggest sector in Britain, and it ranks low for AI exposure. Its defining tasks are physical, clinical and interpersonal. The instructive exceptions are education and professional services, which are both large and highly exposed. That is not a contradiction; it locates the mechanism. Where exposure and scale coincide, it is because the work is document- and analysis-heavy at volume. Where they diverge, health, retail, hospitality, the work resists current models. The same word, “exposure,” is tracking task content, never headcount.
The UK looks more exposed than the US because of what it does, not how it ranks.
IMF analysis puts roughly 70% of UK workers in occupations containing AI-exposed tasks, against about 60% in the US, a gap driven by Britain’s service- and white-collar-heavy economy. But that same structure is what concentrates exposure in a handful of comparatively small, high-value sectors rather than spreading it across the workforce. Our US companion piece sizes its tiles by the actual count of exposed workers, because the American data (Pew) supplies one. Disaggregate the national “70%” by sector and the exposure clusters at the top of the ranking; it does not distribute evenly down it.
Exposure is not displacement and UK hiring data already shows the split.
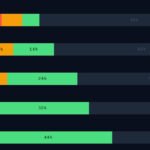
Three years after ChatGPT, ONS-based analysis finds no detectable fall in employment for the most-exposed UK occupations overall; but the average hides two opposite movements. Since 2021, IT business analysts have grown around 38% and programmers 18%, while telephone salespeople have contracted roughly 23% and call-centre roles 19%. The DfE’s own appendix separates “high automation” occupations (call centres, bookkeeping, admin) from the much longer list of merely augmented ones. A sector’s exposure score blends both. The colour on this map shows AI’s reach into a sector; it cannot show the direction of travel.
Methodology note
Tile size is the number of UK workforce jobs in each sector, from the ONS Workforce Jobs by industry series (JOBS02), 2025, rounded to the nearest 0.1 million (UK total ≈ 36.6 million). Workforce Jobs counts jobs rather than people and is used here as the ONS’s most current and robust industry series.
Tile colour is each sector’s position in the Department for Education’s AI-exposure ranking, from “The impact of AI on UK jobs and training” (2023). That study applies the Felten, Raj and Seamans AI Occupational Exposure (AIOE) method to UK occupations and averages the scores to industry level. Crucially, the DfE publishes a relative exposure index, not a share of workers — so unlike the US companion, the UK data does not support a count of exposed workers by sector. Colour, and the “AI exposure” sizing view, therefore reflect each sector’s exposure ranking, not a headcount. The six most-exposed and five least-exposed sectors are taken directly from the DfE; the ordering of mid-ranked sectors is our reading of the same source. Exposure is potential and relative — a low score still implies some exposure — and is not a prediction of job loss.

2 thoughts on “Which UK Sectors Are Most Exposed to AI?”